EMT Practice Test

1. Question Content...

Question List

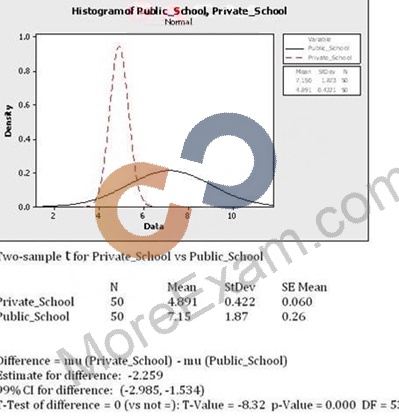
Question1: The class score distribution of schools in a metropolitan area is shown here along with an analysis output. Comment on the statistical significance between the Means of the two distributions. Select the most appropriate statement.

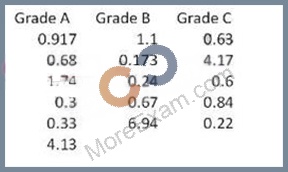
Question2: For the data shown here which statement(s) are true? (Note: There are 2 correct answers).
Question3: The Central Limit Theorem says that as the sample size becomes large the sample Mean distribution will form a Normal Distribution, ____________________.

Question4: Fractional Factorial, ____________and Response Surface Method are types of planned experiments.

Question5: In a Fishbone Diagram the 6M's stand for Methods, ____________, Machine, Man, Mother Nature and Materials.

Question6: For the data set shown here which of these statements is/are true?
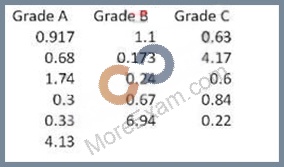
Question7: A ___________ problem in the Measurement System suggests that there is a lack of consistency in the measurement over time.

Question8: Data that can be measured on a continuum and has meaningful decimal subdivisions are __________ data.

Question9: During the ______________ phase of 5S is when we might implement a Red Tag program.
Question10: If a Six Sigma project was to reduce changeover times and the team found the project success was decreasing over time since changeover times began to creep back up, which Lean tools should be considered in the Control Phase to reestablish and sustain the project success?

Question11: Following process modifications, the Null Hypothesis states that no improvement to the process has occurred. If we discover the Null Hypothesis Test was rejected when it was false that would be a(n) ________________________.

Question12: As a means of measuring the effects on other areas of a process as a result of changes in the primary metric we also define and track ________________.

Question13: Accuracy can be assessed in several ways and a fairly accurate means of measurement is visual comparison.

Question14: A Factorial Experiment based on a Level 2 Design with 4 factors would require 16 runs to fully assess the interactions.

Question15: The relationship between a response variable and one or more independent variables is investigated and modeled by use of __________________.

Question16: Six Sigma is a business improvement discipline whose fundamental view is based on a _________ oriented approach of the business.

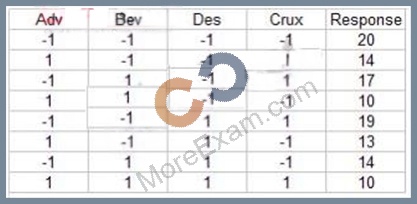
Question17: What conclusion is most correct about the Experimental Design shown here with the response in the far right column?

Question18: Early in a project a Belt will want to begin to identify and evaluate risk factors for the subject process and will therefore begin building a(n) ______________.

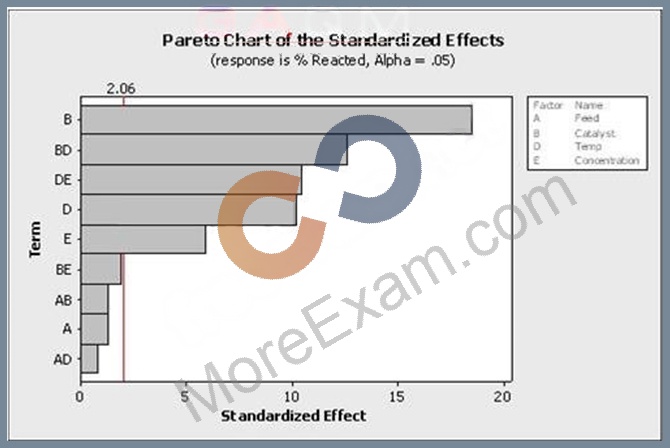
Question19: Which statement(s) are correct about the Pareto Chart shown here for the DOE analysis? (Note: There are 2 correct answers).

Question20: For Attribute Data, Process Capability is defined as the average proportion of nonconforming products.

Question21: Which of these items are not parts of what is necessary for successful Kaizens?

Question22: Appropriate measures means that measurements are ______________.

Question23: Which one of these tools is frequently used to help drill down to possible causes once a Fishbone Diagram is constructed?

Question24: A dock worker for a feed supplier was tasked with assuring the proper weight in the feed bags as they left the dock. One of the columns listed the range of weight of the bags included in the studies. This required plotting a Histogram of the weight of the bags. While drawing the Histogram the x-axis contained a certain scale of data. Pick the scale of data that is appropriate for Histograms.

Question25: For a Kanban to be successful which of these must occur?

Question26: An ANOVA used across many dependent variables could increase the Beta risk.

Question27: The Waste of Overproduction is defined as ______________________.
Question28: When doing Hypothesis Testing on Non-normal data Belts will use a ________________ to compare more than two sample proportions to each other.

Question29: The method of Steepest Ascent guides you toward a target inside the original inference space.

Question30: A Belt working in a supply chain environment has to make a decision to change suppliers of critical raw materials for a new product upgrade. The purchasing manager is depending on the Belt's effort requiring that the average cost of an internal critical raw material component be less than or equal to $2,800 in order to stay within budget. Using a sample of 55 first article components, a Mean of the new product upgrade price of $2,240 and a Standard Deviation of $120 was estimated. Based on the data provided, the Z value for the data assuming a Normal Distribution is?

Question31: The Japanese born function of a Kaizen event utilizes a specific, step-by-step approach meant to bring about major changes to a process.

Question32: Using this partial Z Table, how many units from a month's production run are expected to not satisfy customer requirements for the following process?
Upper specification limit: 7.2 Lower specification limit: 4.3 Mean of the process: 5.9 Standard Deviation: 0.65 Monthly production: 450 units

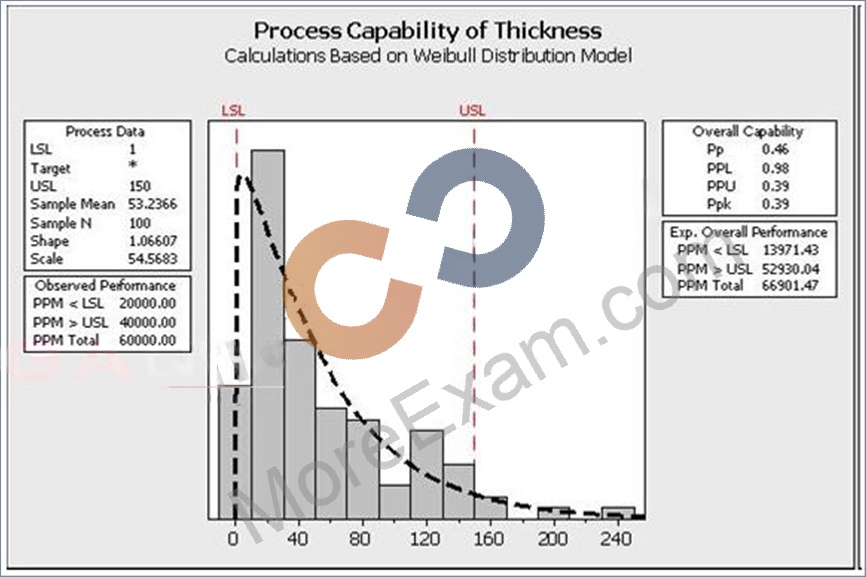
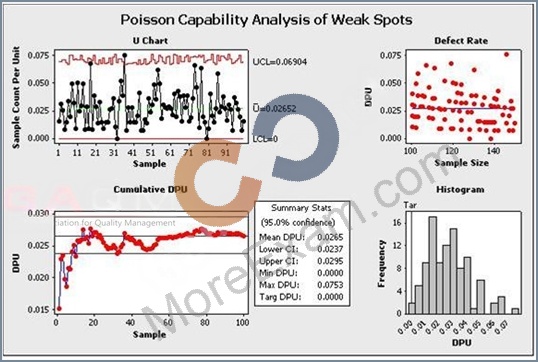
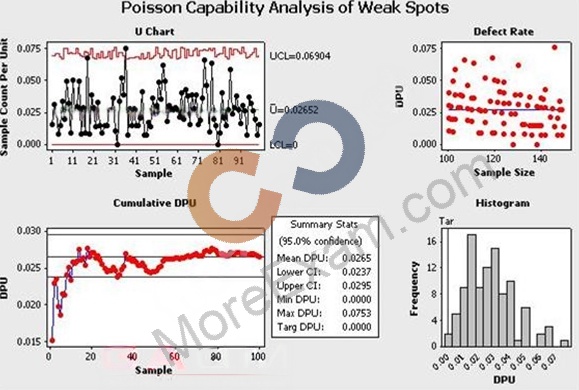
Question33: Which statements are correct about the advanced Capability Analysis shown here? (Note: There are 3 correct answers).

Question34: Since Normality is required if we intend to use the data collected as a predictive tool. To test for Normality of data we must determine if the P-value is ___________.

Question35: Questions that can be best answered by a Visual Factory include all of these except
_____________________.

Question36: If you can Poka-Yoke a defect out of the process entirely then you do not need use SPC on the characteristic of interest in the defect.

Question37: For Attribute Data, Process Capability is defined as the average proportion of nonconforming products.

Question38: Which one of the listed tools is frequently used to help drill down to possible causes once a Fishbone Diagram is constructed?

Question39: An operator is measuring the distance between two points. Which is most likely to be influenced by the operator?

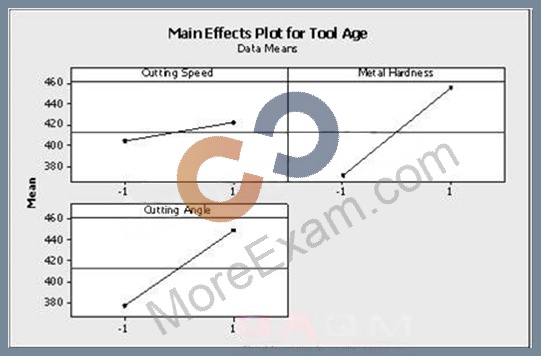
Question40: Which statement(s) are correct about the DOE Factorial plot output here? (Note: There are 3 correct answers).

Question41: To be an effective Lean Six Sigma practitioner one must understand the difference between ___________________________.

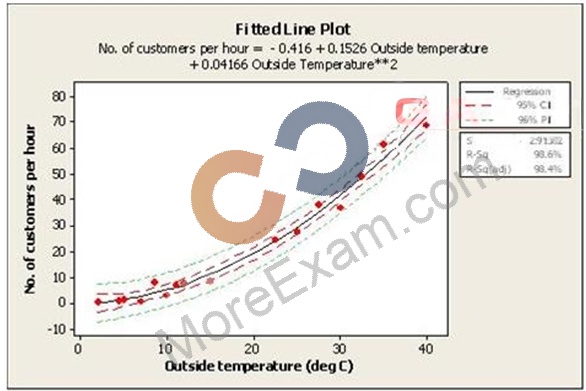
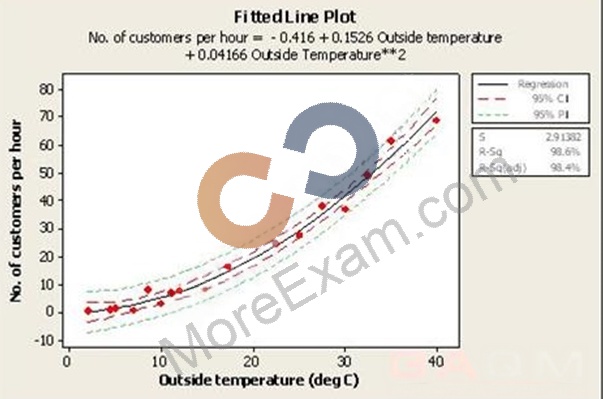
Question42: Which statement(s) are correct about the Regression shown here? (Note: There are 2 correct answers).

Question43: Review the analysis shown here. Which statements are true about the process? (Note: There are 3 correct answers).

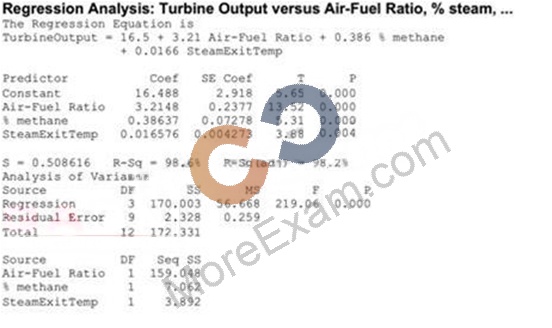
Question44: Which statement(s) are most correct for the Regression Analysis shown here?
Question45: Sally and Sara sell flower pots at their garage sale. Sally motivates Sara mentioning that they will sell a minimum of 22 pots per day if the outside temperature exceeds 60o
F. From a sample, whose population is assumed to follow a Normal Distribution, taken for 30 days at 60 degrees or more an average of 18.2 pots per day were sold with a Standard Deviation of 0.9 pots. What is the Z value for this sales process?

Question46: When the Inputs, X's, for your process are Normally Distributed about the Mean, the Outputs, Y's, will always be Normally Distributed.

Question47: A valid Multiple Linear Regression (MLR) is characterized by all of these except?

Question48: The Control Limits width varies if the sample size varies for which type of chart?

Question49: An operator checks that all boxes being packed contain enough products to fill the box. However, each box getting filled has a different number of products in it. This is a Reproducibility problem, not a Repeatability problem.

Question50: An example of the waste of mismanaged Inventory is __________.
Question51: The most appropriate type of FMEA for a product before going into manufacturing is a ___________ FMEA

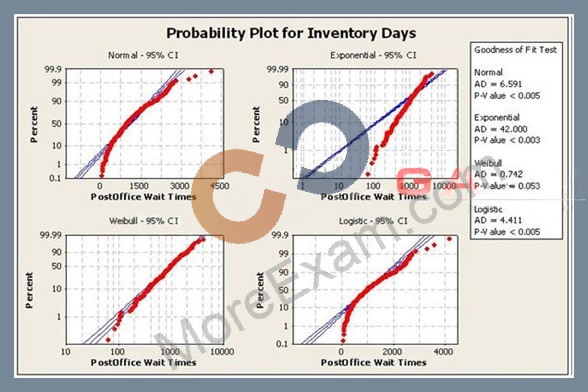
Question52: A Lean Six Sigma project is attempting to reduce inventory days. The Process Capability will be monitored as part of the Control Phase to track the sustainability of the improvement. Which distribution type is best used for performing the Capability Analysis?

Question53: A Personal Trainer was assessing her workout class participants for their body fat content and had to include data for her analysis. One of the columns listed the range of weight of the people included in the studies. This required plotting a Histogram of the weight of the people assessed for their body fat content. While drawing the Histogram the x-axis contained a certain scale of data. Pick the scale of data that is appropriate for Histograms.

Question54: Which statement(s) are correct about the Regression shown here? (Note: There are 2 correct answers).

Question55: What is the Ppk of a process with a spread of 24 units, an average of 68, an upper limit of 82 and a lower limit of 54?

Question56: The Mann-Whitney test is a powerful test and is unique to situations from which of the choices listed? (Note: There are 2 correct answers).

Question57: Which statements are correct about the advanced Capability Analysis shown here?
(Note: There are 3 correct answers).

Question58: Relative to a Design of Experiments the term Collinear refers to variables being a ________________ of each other.

Question59: If in an experiment all possible variable pairs sum to zero the design is Orthogonal.

Question60: Which statement(s) are incorrect for the Regression Analysis shown here? (Note: There are 2 correct answers).

Question61: Early in a project a Belt will want to begin to identify and evaluate risk factors for the subject process and will therefore begin building a(n) ________.

Question62: When we compare short-term and long-term Capability which of these is true?

Question63: Use this data to calculate the Z score. Average oF. 65, Standard Deviation: 3, Upper Spec Limit:
72

Question64: Using this data calculate the percentage of DPU.
Data: 763 defects, 18,000 units.

Question65: A valid mathematical Regression represents all of the characteristics shown except
___________________________.

Question66: Each of the items listed would impact the Process Capability for a process with a continuous output except ___________________.

Question67: The reported Cpk for a process with an average of 98 units, a spread of 16 units and upper and lower specification limits of 115 and 90 units would be?

Question68: Which of the items listed do not define what an X-Y Diagram is?

Question69: A valuable tool to use during the Measure Phase to show material and information flow throughout an entire process is the ______________ .

Question70: Calculate the Rolled Throughput Yield of this process using this data. Data. unit input: 1450, unit output: 1390, defects repaireD. 320, scrap: 60

Question71: With Measurement System Analysis we are concerned with two issues that impact the potential variability of the data. They are ____________ and Accuracy.

Question72: If a process has subgroups for Variable data and the process runs for a long period of time, then the best pair of SPC Charts to use would be an Xbar and _________.

Question73: The English words used for the 5S's are Sorting, Straightening, _____________ , __________ and Sustaining. (Note: There are 2 correct answers).

Question74: An operator checks that all boxes being packed contain enough products to fill the box. However, each box getting filled has a different number of products in it. This is a Reproducibility problem, not a Repeatability problem.

Question75: Much of the Six Sigma methodology is used to identify and remove causes for _____________.

Question76: The two types of data that can be used in Statistical Analysis are Attribute and Variable.

Question77: Kaizens or Kaikakus and Six Sigma projects are intended to create breakthrough, significant process improvement versus minor, incremental improvements.

Question78: For the data set shown here which of these statements is/are true?

Question79: Screening experiments are the proper choice when a Belt is faced with the situation of highly Fractional Factorial Designs.

Question80: When conducting a Hypothesis Test using Continuous Data the proper sample size is influenced by the extent to which we need to assess a Difference to be detected and the inherent variation in the process.

Question81: Use this data to calculate the Z Score. Average of: 92, Standard Deviation: 2, Upper Spec Limit: 101

Question82: Using this data calculate the percentage of DPU.

Question83: A valid mathematical Regression represents all of the characteristics shown except _________________.

Question84: The _____________ Distribution would be the most desirable for modeling the number of stitch defects in a portion of fabric.

Question85: Kanban establishes a means of monitoring production, conveyance and delivery information such that efficient flow is established. The method used by Kanban is to require a _________ before anything moves.

Question86: One of the primary deliverables from performing a SIPOC is to begin to understand which outputs have the greatest affect on the customer most valued inputs.

Question87: Choose those characteristics of a Simple Linear Regression (SLR) Analysis that are applicable. (Note: There are 3 correct answers).

Question88: Handling of warranty returns, process improvement team meetings and rework to meet customer expectations are all examples of business costs that are classified as ________________ .