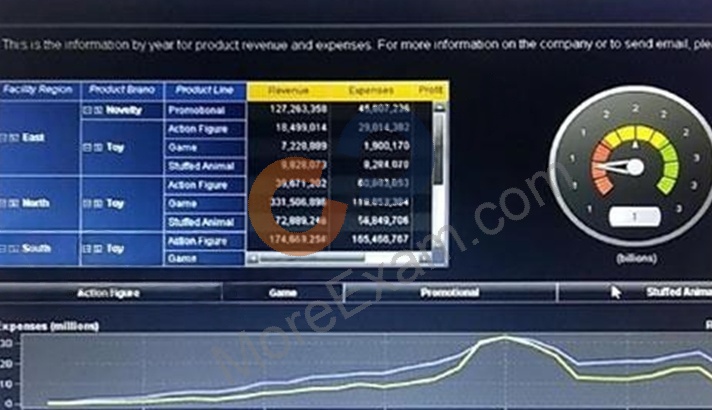
EMT Practice Test

1. Question Content...


Question List

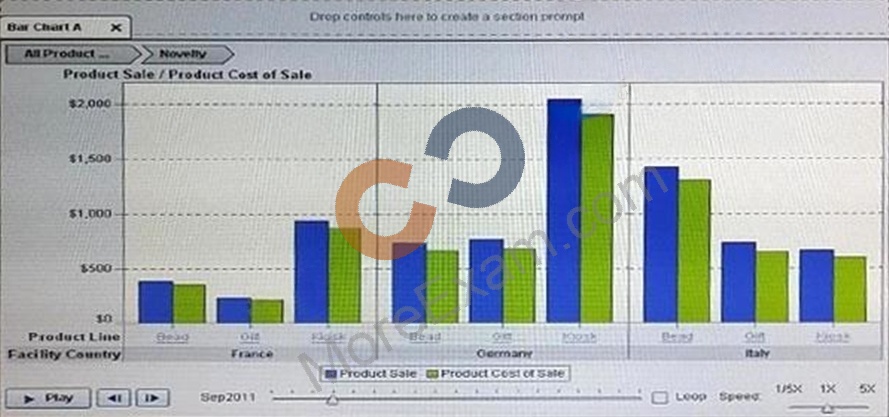
Question1: Refer to the exhibit shown:

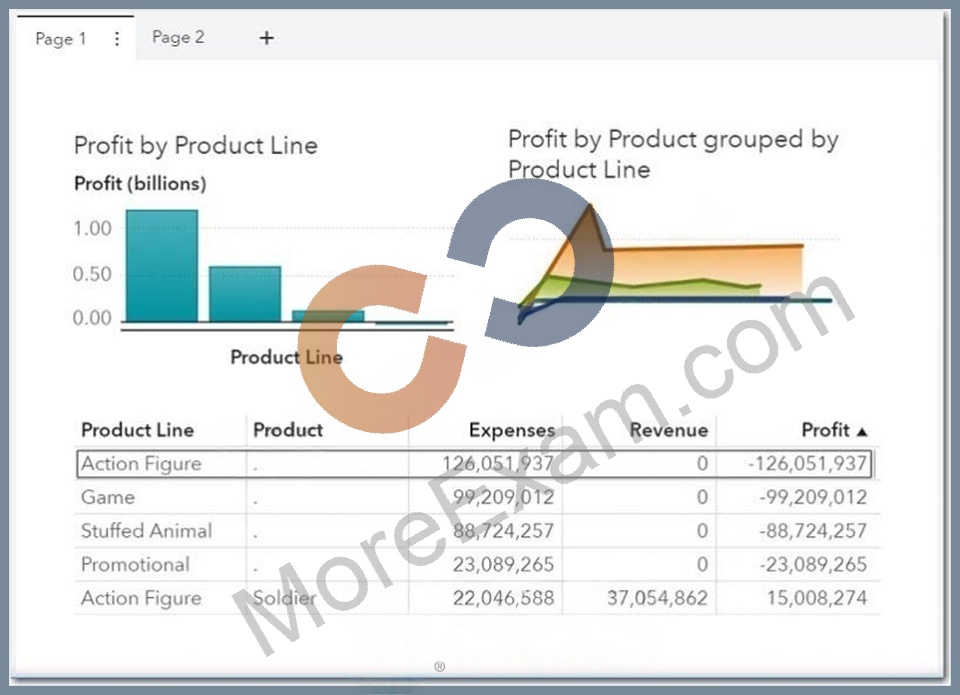
Two vertical bar charts are shown, first thin lines and the next thick bars.
Which method does the content developer use to change visualization1 to visualization 2.

Question2: Which method is not used to share Explorations from SAS Visual Analytics Explorer?

Question3: A report designer needs to take a value from a control object and use it in a calculated item.
Which component should the designer use?

Question4: When adding a display rule to a dual axis line chart, which statement is TRUE?
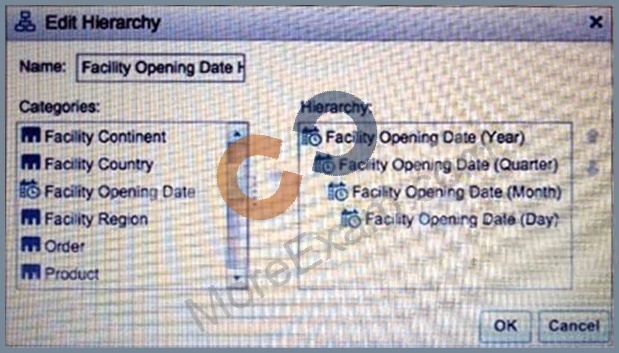
Question5: Refer to the Exhibit below:
The Create Date Hierarchy option was used in SAS Visual Analytics Explorer to create the hierarchy shown.....

Which statement is true about Facility Opening Date (Day)?

Question6: Refer to the exhibits:

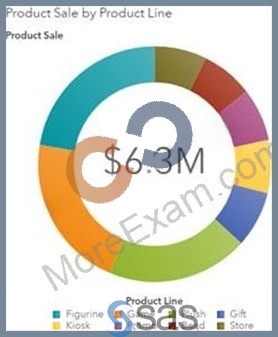
Which option has been added to change the pie chart from Exhibit A to Exhibit B?

Question7: Refer to the exhibits:

How do you change the report in Exhibit A to look like Exhibit B?
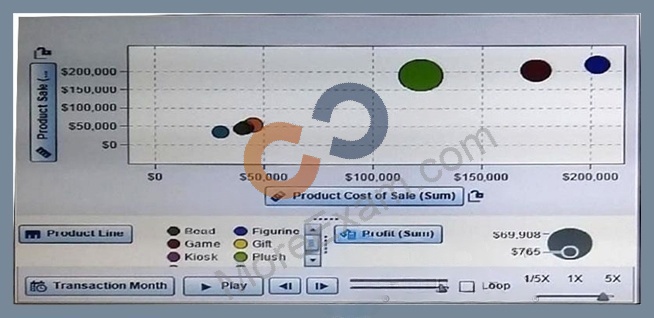
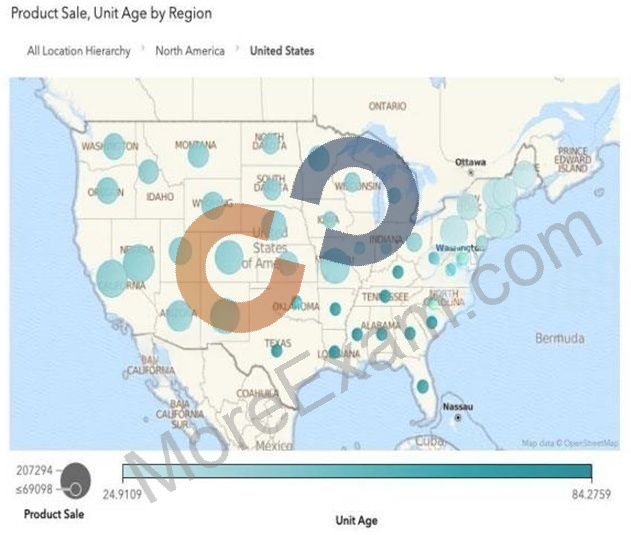
Question8: A bubble plot is given, Refer the Exhibit:

For this bubble plot visualization created in SAS Visual Analytics Explorer, which statement about the data item role assignments is true.

Question9: When working with the text topics object, what must the report designer set in order to use it in a report?

Question10: Refer to the exhibit below:
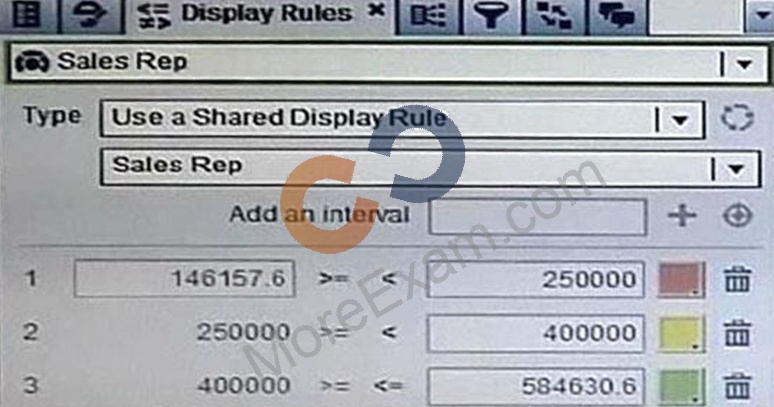
Why are the interval value cells grayed out?

Question11: When sorting a list table object, which statement is TRUE?

Question12: For a cross tab visualization created with SAS VISUAL ANALYTICS EXPLORER which statement is true.

Question13: How can SAS LASR analytic server libraries be used in SAS Visual Data Builder?

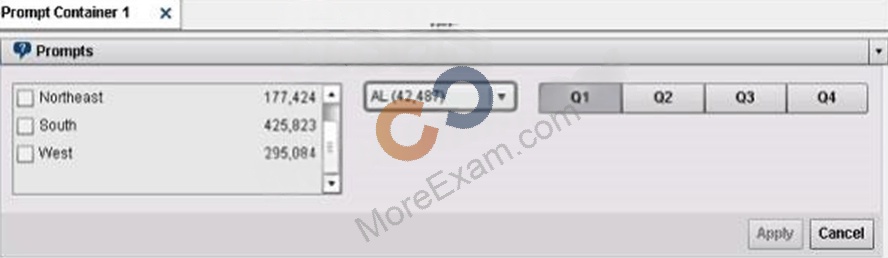
Question14: The current page has page prompts displayed at the top of the page as shown in the below exhibit:

Which control object CANNOT be used in the page prompt area unless it is part of a prompt container?

Question15: In SAS VA Designer, all report objects have a property 'Enable selection in the viewers'. when enabled how does this property affect the report object when viewed on a mobile device?

Question16: A category and measure are dragged to the report canvas, and a bar chart is automatically created.
If you wanted to use a treemap instead, what action would you take?

Question17: Refer to the exhibit:

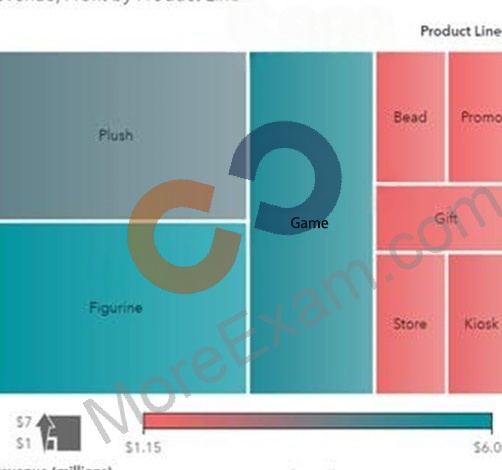
In this treemap from SAS Visual Analytics, Profit is currently assigned the role of Color.
If Profit were removed from this role, what would happen?

Question18: Using SAS Visual Analytics Explorer, a content developer would like to examine the relationship between two measures with high cardinality.
Which visualization should the developer use?

Question19: Refer to the exhibit:

Which Link color option has been set on the path analysis object?

Question20: In SAS Visual Analytics Designer, the data items in the data tab are displayed based on classification.
What is the process to group data items on the data tab in alphabetical order.

Question21: How is a link created from a chart to a SAS stored process in SAS Visual Analytics Designer?

Question22: Refer to the exhibit:

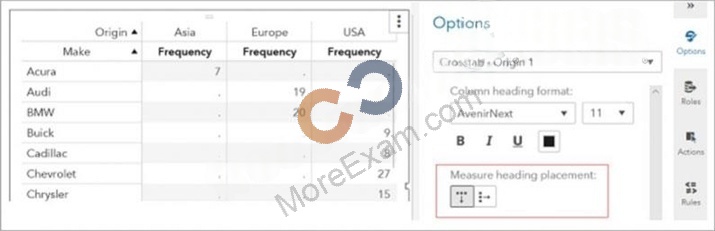
Which is TRUE when the Measure heading placement is changed?

Question23: Which source table is structured appropriately for path analysis?
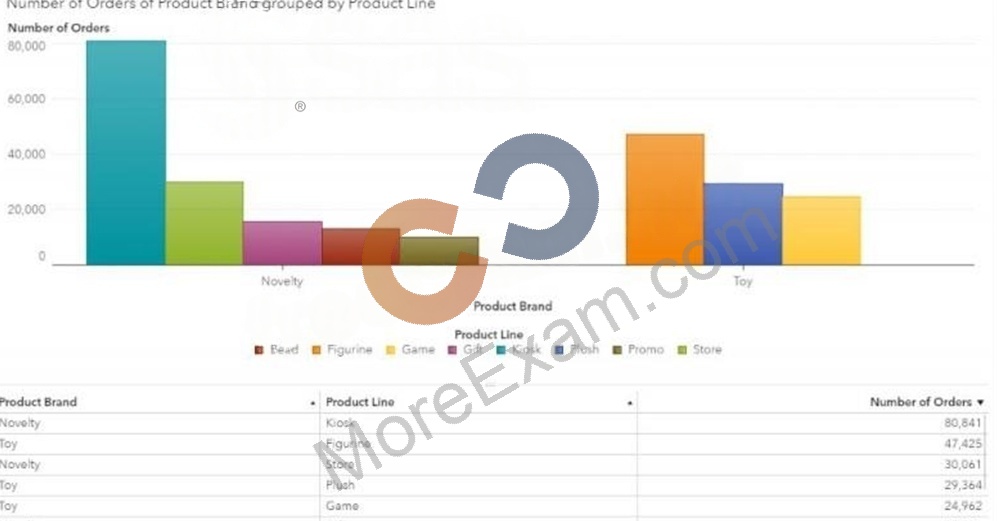
Question24: Refer to the bar chart from SAS Visual Analytics in the exhibit below.

Note the details table for the report object.
How do you view the details table for the bar chart object?

Question25: Refer to the bar chart from SAS Visual Analytics Designer

How are data items assigned to the roles for this bar chart?

Question26: The following comma-delimited file is imported into SAS Visual Analytics:
- Product, Color, Size, SKU, Cost
- Bead, Black,20mm,107712,100
- Bead, Blue,4mm,435770,50
- Bead, Clear,20mm,1BC123,100
- Bead, Gold,20mm,FA3445,100
- Bead, Green,20mm,98A421,100
Assume the first row contains column names, and the number of rows scanned on import is 2.
What type of data item will SKU be?

Question27: For a cross tab report object created in SAS Visual Analytics Designer, which statement is true?

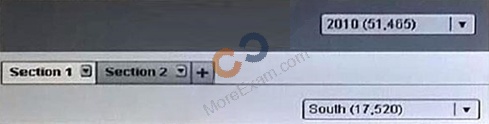
Question28: Refer the exhibit below:

A content developer creates the above report in SAS Visual Analytics Designer. The report contains a report prompt, where year is set to 2010, and a section prompt on section 1 where region is set to south.
How will this report be filtered based on these prompt values?

Question29: A new calculated item created in SAS Visual Analytics Explorer is based on Which type of Data?

Question30: How does a report designer determine whether the values of a measure data item are unique?

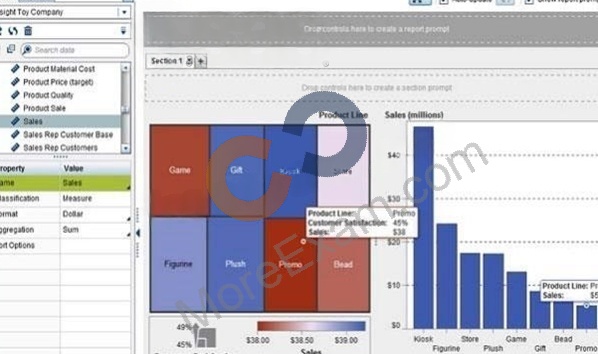
Question31: Refer to the exhibit below from SAS Visual Analytics Designer.

Why is the value for Sales lower in the treemap than in the bar chart?

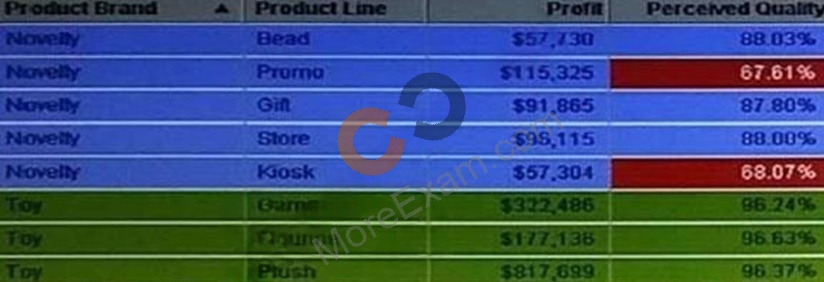
Question32: Refer to the list table from SAS Visual Analytics Designer below.

Select two types of display rules that are applied to this list table report object. (Choose Two).

Question33: Which part of the user interface allows you to change the classification of a measure data item?

Question34: Which statement is TRUE when importing Microsoft Office Access files into SAS Visual Analytics?

Question35: Refer to the exhibit below.

A content developer has a created a report that contains the Prompt Container pictured above.
Which set of properties matches what is shown in the Prompt Container?

Question36: Refer to the exhibit:

The report designer has just changed the filter to add more data to this line chart.
Why are some of the lines outside of view?

Question37: Refer to the exhibit:

How did the report designer include information (which is highlighted in the red box) about interactive filte rs?

Question38: In SAS Visual Analytics Designer, which statement is not true about text objects?

Question39: In SAS Visual Analytics Designer, which feature is used to email multiple reports at the same time?

Question40: A content developer is working in SAS Visual Analytics Explorer currently the data pane only displays some of the data items in the data source.
Why are some of the data items not displayed?

Question41: In visual analytics designer, how can multiple data sources be added to a single section?

Question42: Which option CANNOT be added to a scatter plot or heat map?

Question43: Which statement is TRUE about report alerts?

Question44: While working in SAS Visual Analytics Designer, a content developer needs t take a value from a control and use it in a calculated item.
Which component should the developer use?

Question45: Which is NOT a technique to move an object to a different page?

Question46: The content developer has just changed the filter to add more data to this line chart in SAS visual analytics Explorer, are some of the lines outside of view?

Question47: When constructing a word cloud with SAS Visual Analytics Explorer, what must the content developer supply in order to use Text Analytics?

Question48: Which action will cause a list table object to display rows of detail data instead of aggregated data?

Question49: Refer to the two exhibits:
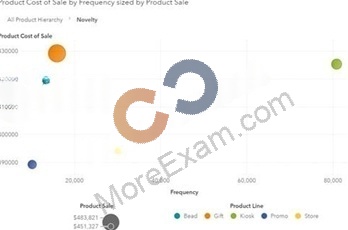
What option was added to the bubble plot in Exhibit B?
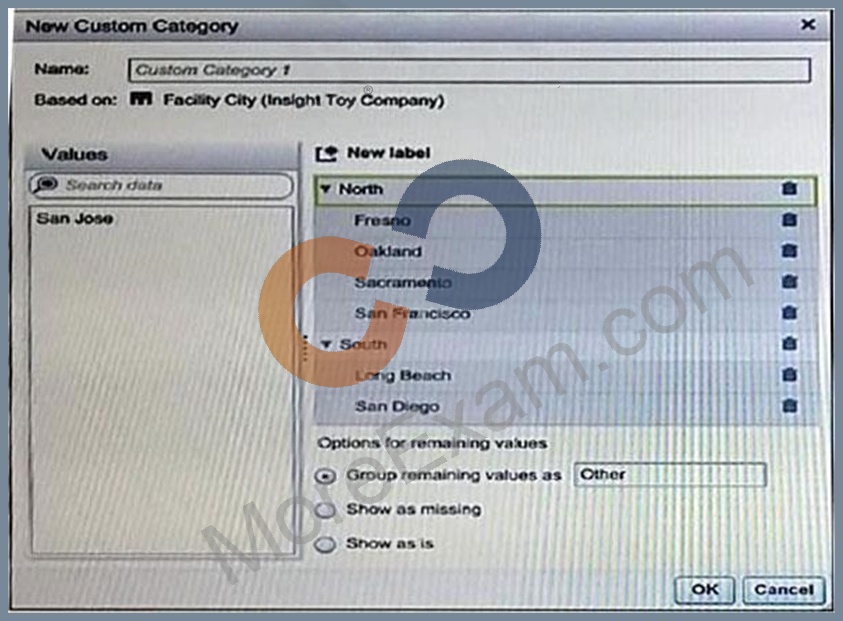
Question50: Refer to the exhibit below:

Assuming that there are data values for each city, how many different labels will be displayed when using this data item?

Question51: In SAS Visual Analytics Designer, which statement is not true about text objects?
Question52: In a bar chart created in SAS Visual Analytics Designer, what is the effect of setting the grouping scale property to normalize groups to 100%?

Question53: Refer to the exhibit:

What must a report designer do to create this chart using automatic chart object? (Choose three.)

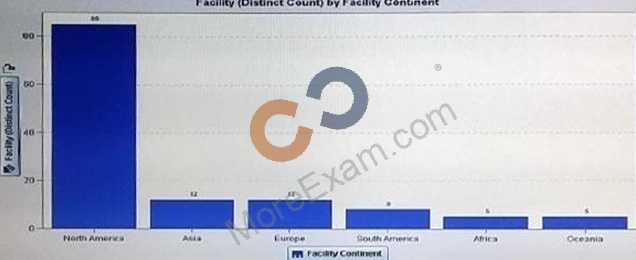
Question54: Refer to the exhibit below:

How does the content developer create the facility (Distinct Count) data Item?

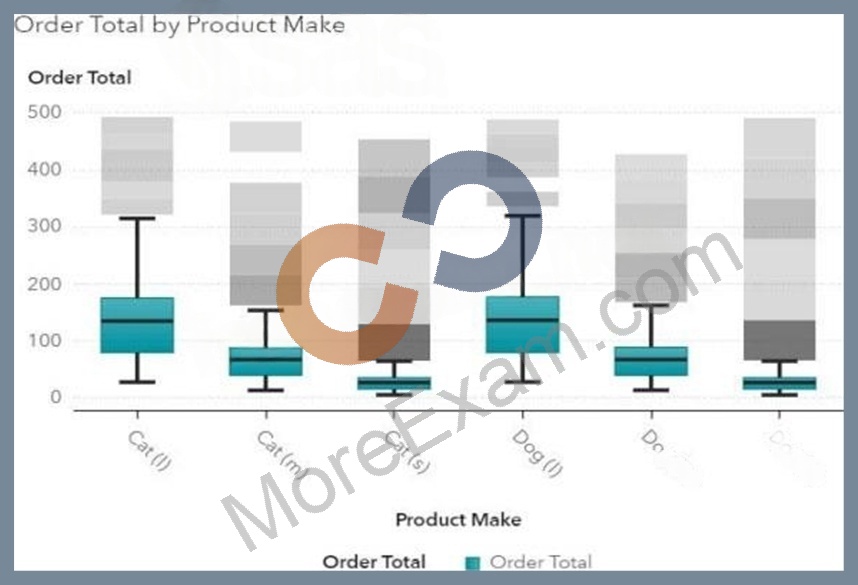
Question55: Refer to the box plot from SAS Visual Analytics on the right.

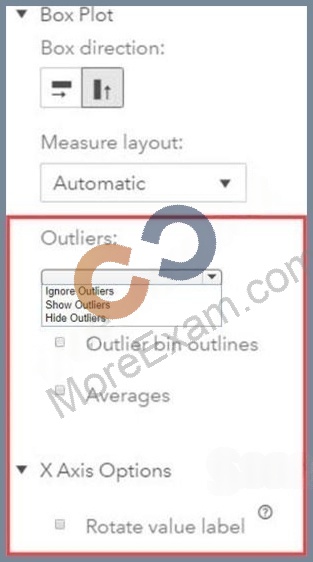
In the work area below, a Properties Panel for the box plot is shown. There is one drop down menu and three check boxes inside a red box. Configure the drop down menu and check boxes values that will configure the box plot as shown.
Work area:

Question56: Refer to the exhibit below:

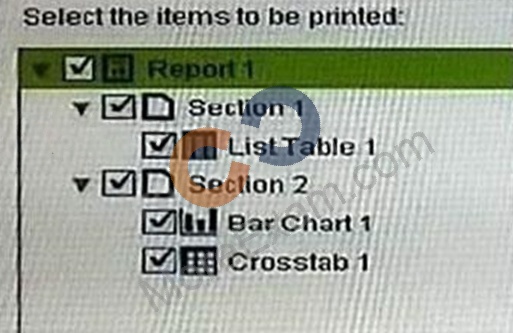
Select the Items to be printed: list table 1, Bar chart1, Crosstab 1. A SAS Visual Analytics Designer report is created, the user select File > Print to PDF and the selects all of the check boxes shown in the exhibit.
How many objects will be printed?

Question57: A content developer creates a display rule for a crosstab.
What changes can the display rule apply to the crosstab?

Question58: Refer to the exhibit below:

When creating a report in SAS Visual Analytics Designer, which tab do you use to change the values displayed in the parenthesis?

Question59: What happens when a report page is duplicated?

Question60: In SAS Visual Analytics Designer, the crosstab report object supports which feature?

Question61: See the Exhibit below to refer to two Scatter Plot objects created in SAS Visual Analytics. Both objects are using the same data source and have identical data item role assignments.

What is different between the two objects?

Question62: When using SAS Visual Analytics Explorer, what is the difference between importing a SAS data set on a server versus importing a local SAS data set?

Question63: In SAS Visual Analytics Explorer, which feature explores underlying Factors by specifying Target Values for the Forecast Measure?

Question64: SAS Visual Analytics assigns colors dynamically to category values to grouped visualizations.
How would a content developer specify a specific color for a category Values?

Question65: Refer the exhibit below:

What is the minimum number of report objects required to create this report in SAS Visual Analytics Designer.

Question66: A content developer has created an exploration in SAS visual Analytics Explorer with a large number of visualizations.
How can the developer manipulate the display of the visualizations.