EMT Practice Test

1. Question Content...


Question List

Question1: Which assessment feature is available when modeling logistic regression models in SAS Visual Statistics?

Question2: Refer to the exhibit from a linear regression model in SAS Visual Statistics.

Based on the table above and assuming a significance level of 0.05, what can be concluded about the linear regression model?

Question3: When implementing score code in SAS Enterprise Guide, which step is typically involved in the process?

Question4: How can score code be implemented to score new data using SAS Enterprise Miner?
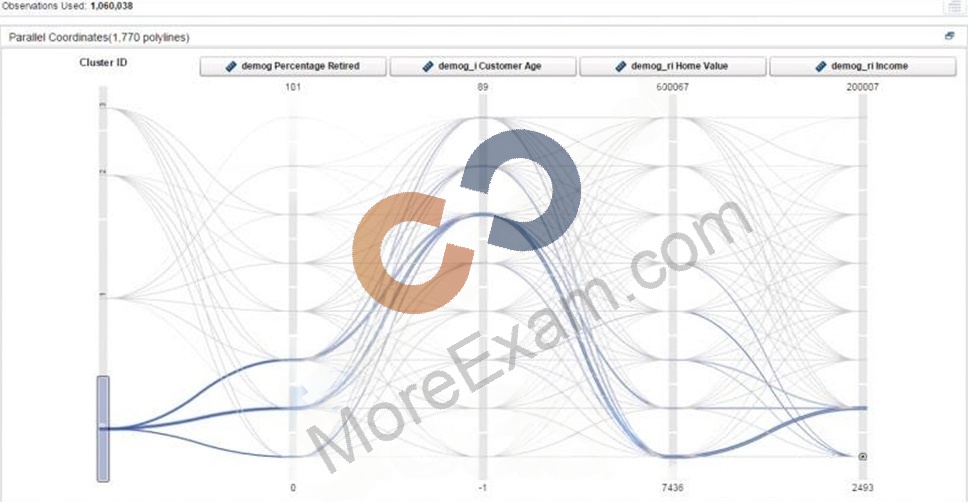
Question5: Refer to the Parallel Coordinates Plot shown on the Exhibit.

Which two statements about cluster 0 in the Parallel Coordinates Plot are correct? (Choose two.)

Question6: What is unsupervised classification in the context of cluster analysis?
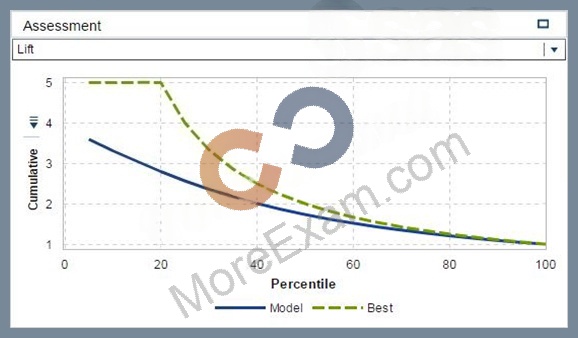
Question7: Refer to the exhibit from SAS Visual Statistics:

What can be concluded from the lift plot shown in the exhibit?

Question8: Which modeling technique automatically includes missing values?

Question9: You want to build a model that predicts whether a customer will default on a loan assuming an underlying binomial distribution.
Which model within SAS Visual Statistics would you use?

Question10: Which statement is true for the Informative Missingness property in SAS Visual Statistics?

Question11: When performing a logistic regression in SAS Visual Statistics, the default prediction cutoff is .50. If you increase the cutoff to .80 then derive predicted values, which statement is the expected outcome?

Question12: When building a Generalized Linear Model in SAS Visual Statistics, which link function is available?

Question13: What are some properties that can be defined in a linear regression model?

Question14: When assigning roles in a GLM, what does the "offset" variable typically represent?

Question15: In SAS Visual Analytics, what is the purpose of creating an aggregated measure?

Question16: When should you replace dirty data with missing values in SAS Visual Analytics?
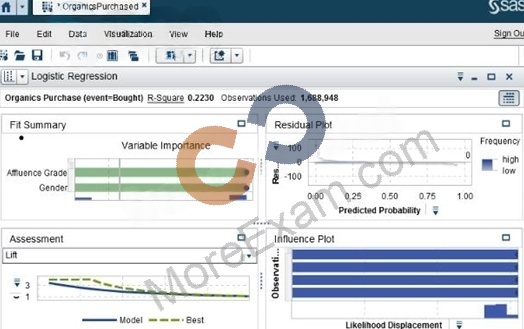
Question17: In the below linear regression results display, where would you click to access the parameter estimates?

Question18: What are the benefits of applying filters to both visualization and data source in SAS Visual Analytics?

Question19: When evaluating a Misclassification plot, what does it typically show?

Question20: What is the primary purpose of modeling effects in linear regression?

Question21: Given a scenario where the response variable represents the time until an event occurs, what distribution and link function might be appropriate for modeling?

Question22: Which statement is TRUE regarding a generalized additive model (GAM) in SAS Visual Analytics?

Question23: When exporting score code, what information is typically included in the code?

Question24: When reviewing Measure Details in SAS Visual Analytics, what information can you find related to measures?

Question25: Why are decision trees a useful technique for segmentation?
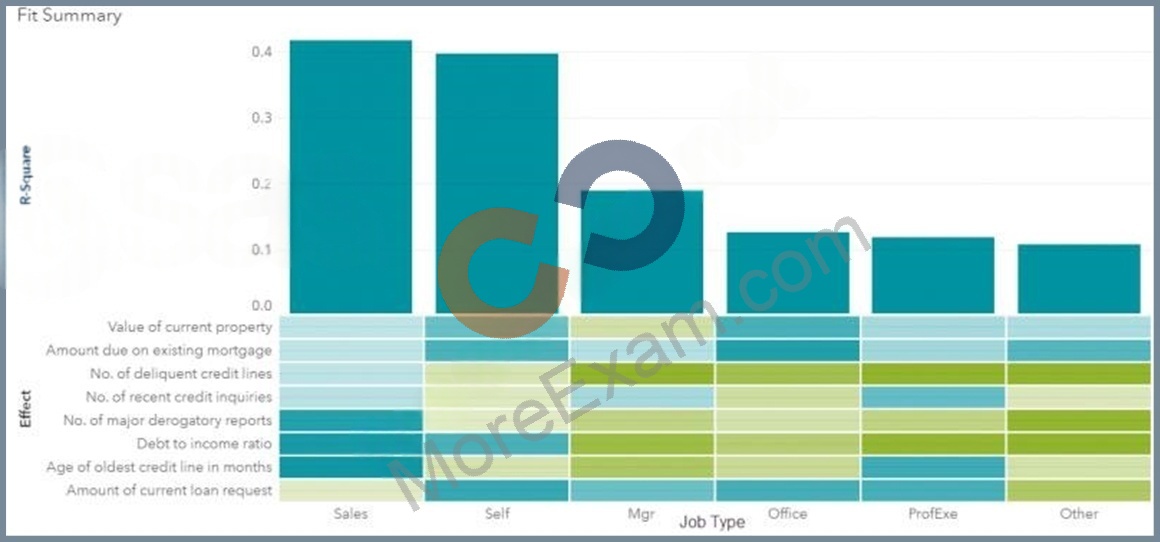
Question26: Refer to the fit summary from in the exhibit below.

What can be concluded from the fit summary?

Question27: When interpreting a Misclassification plot in model comparison, what does it typically show?

Question28: Which statement is true for negative binomial and Poisson regression models?

Question29: When performing linear regression modeling, what is the primary goal of assessing multicollinearity among predictors?

Question30: How is a multinomial response variable used in SAS Visual Statistics when building a logistic regression model?

Question31: What is the primary purpose of assigning variable roles in linear regression?

Question32: In SAS Visual Analytics, which of the following tasks involves converting a categorical variable into a numerical one?

Question33: In SAS Visual Analytics, what can you use to choose the best fitting group-by model?

Question34: Your data contains a column for Country that contains 350 unique values. There are multiple entries for some countries (Japan, JPN, japan, etc.). You want a unique value for each country.
Which is the most efficient way to correct inconsistent values?

Question35: What properties can be defined in a logistic regression model?

Question36: In the context of assessing model results, what information can be interpreted from the Fit Summary window?

Question37: You want to use a generalized linear model to predict donation amount from a set of demographics predictors. Donation amount is known to be right-skewed, with many non-donors (donation amount = 0).
Which settings in the Generalized Linear Model task are most appropriate for modeling this response?

Question38: What are variable selection methods for decision trees used to determine the most important features?

Question39: Refer to the exhibit:

Prior to performing a decision tree analysis, you need to assess the default Values of Classification and Model Type Properties for Sale Amount. The variable represents product purchase amounts from an organization's e-commerce website.
How do you want the decision tree algorithm to treat this variable?

Question40: What information can you interpret from a Cluster Matrix?

Question41: When building a predictive model with logistic regression, when should you choose an appropriate link function?

Question42: Which statement is true about performing regressions in SAS Visual Statistics?

Question43: What does the Variable Importance feature help with when choosing the best fitting group-by model?

Question44: What does it mean to create dummy variables in SAS Visual Data Builder?

Question45: What does adding an interaction effect in linear regression modeling allow you to capture?

Question46: What are decision tree properties that can be defined during model construction?

Question47: The Leaf size property within a decision tree is changed from 5 to 10 and no other stopping rules were met.
How will the tree change?

Question48: Which equation does NOT represent a linear model? Note: bi are parameters and Xi are variables.

Question49: What is the primary purpose of choosing an appropriate distribution in a generalized linear model?

Question50: Refer to the exhibit from a linear regression model in SAS Visual Statistics:

Based on the table above and assuming a significance level of 0.05, what can be concluded about the linear regression model?

Question51: Select the best distribution to model with linear regression.

Question52: In linear regression, what does a high p-value for a predictor variable suggest?

Question53: When assessing the quality of a linear regression model, what does a low p-value associated with the F-statistic suggest?

Question54: When interpreting comparison results using the Assessment panel, what information can be obtained?

Question55: Given an Influence Plot generated in a Linear Regression within SAS Visual Statistics, which diagnostic can be used to quantify leverage?

Question56: How does SAS Data Integration Studio facilitate scoring new data using exported score code?

Question57: What are the essentials of logistic regression?

Question58: What is the primary purpose of scoring functionality in SAS Visual Statistics?

Question59: What are some properties that can be defined in a generalized linear regression model?
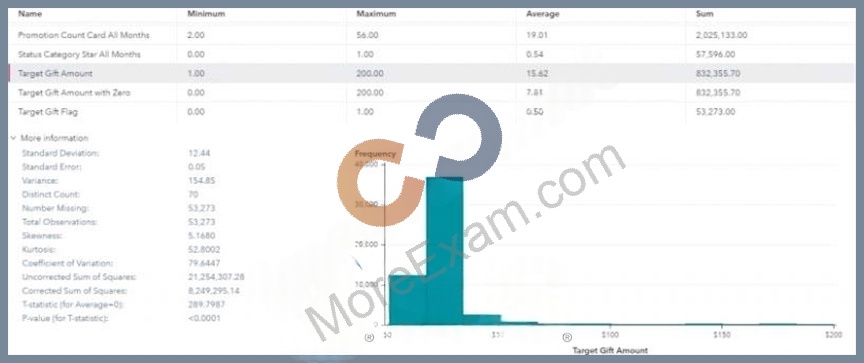
Question60: Refer to the exhibit:

Which is the modeling approach that should be used when fitting the Target Gift Amount variable?

Question61: In the context of linear regression, what does the term "linearity" refer to?

Question62: Given a scenario where the response variable represents the number of accidents in a day, what distribution and link function might be appropriate for modeling?

Question63: What information is conveyed by a Summary bar in model assessment?

Question64: You want to filter out certain observations to analyze their effect on the model.

Which windows will achieve this? (Choose two.)

Question65: Given a scenario, what condition makes models comparable in SAS Visual Statistics?

Question66: What is the purpose of deriving a cluster ID variable in cluster analysis?

Question67: Which statement is correct about using a multinomial response variable (with 3 or more levels) in the logistic regression task in SAS Visual Statistics?

Question68: When building a cluster analysis in SAS Visual Statistics, which of the following algorithms is commonly used for partitioning data into clusters?

Question69: What is one advantage of using SAS Studio to score new data with exported score code?

Question70: Explain what an icicle plot represents in decision tree analysis.

Question71: In linear regression modeling, what roles are typically assigned to variables?

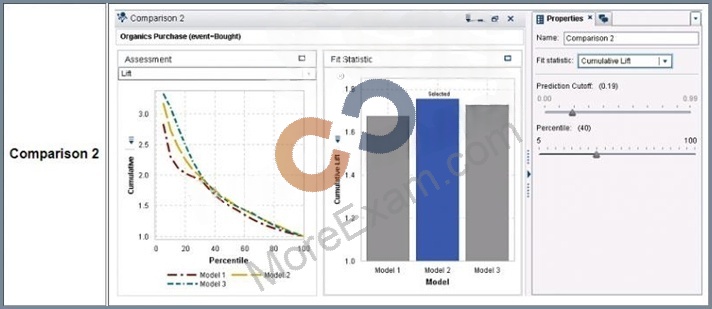
Question72: Refer to the exhibits:


An analyst is evaluating which model to use.
What changed from Comparison 1 to Comparison 2 to select a different champion model?

Question73: What does a ROC chart help assess in model comparison?

Question74: You would like to see the minimum and maximum values for all of your measures so that you can filter variables as needed.
Which is the most efficient way to do that?

Question75: Which statement is true regarding the number of polylines created in a Parallel Coordinates plot during Cluster Analysis?

Question76: How are split points determined in a decision tree?

Question77: Which statement is true regarding the Cluster Analysis in SAS Visual Statistics?

Question78: How can you apply filters to both visualization and data source in SAS Visual Analytics?