MoreExam
1. Question Content...
EXPLANATION
Answer: X - EXPLANATION Content.
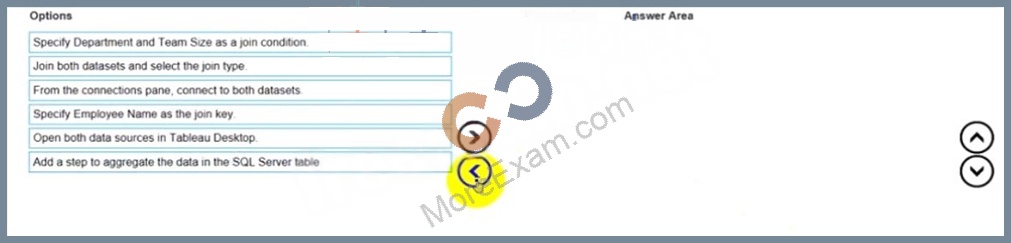
Question1: You have the following two datasets:* A Microsoft Excel worksheet that has two columns named Employee Name and Department* A Microsoft SQL Server table that has three columns named Employee Name. Pay Grade and Team Size.You want to use Tableau Prep to join the two datasets.Which three actions should you perform m order? (Place the three correct options in order.)
Question2: A colleague provides you with access to a folder that contains the following files:* Sates.csv* Bookl.twb* Sates.hyper* Export.mdbWhich He contains an extract?
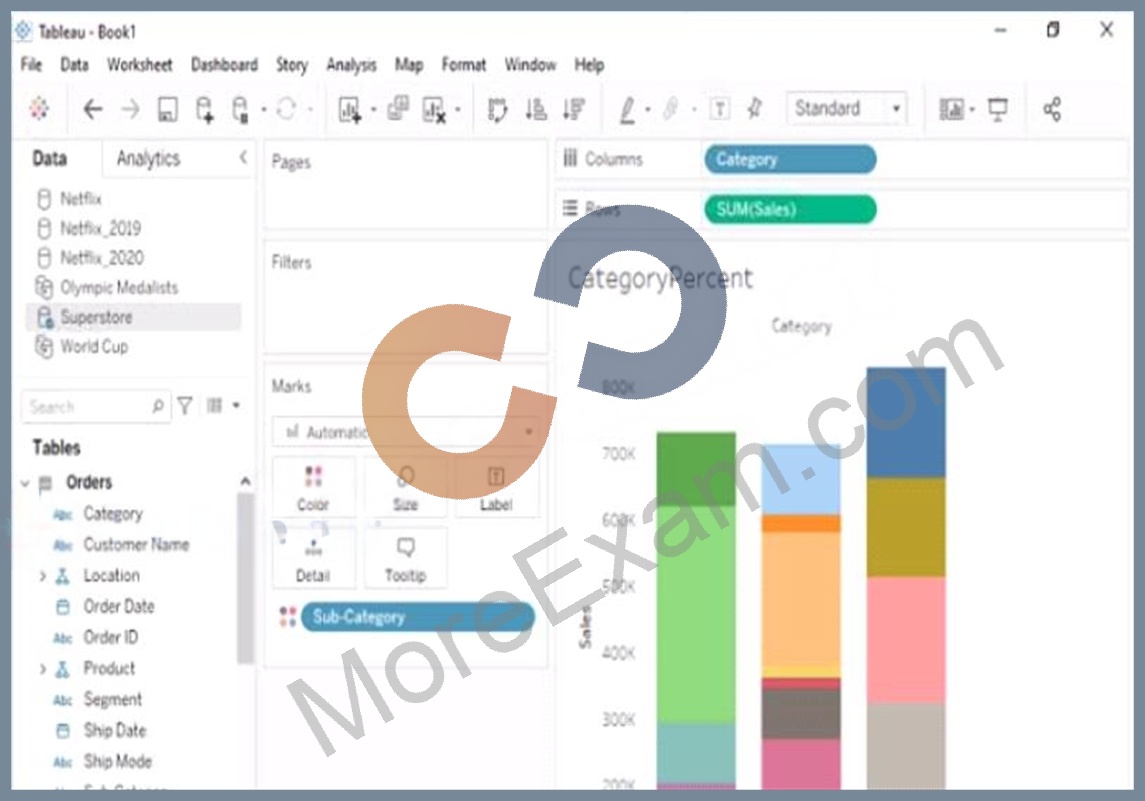
Question3: Open the link to Book1 found on the desktop. Open the CategoryPercentage worksheet.Modify the bar chart show the percentage of sales for each Subcategory within every Category. The total percentage for every Category must be 100%.
Question4: Open the link to Book1 found on the desktop. Open the Histogram worksheet and use the Superstone data source.Create a histogram on the Quantity field by using bin size of 3.
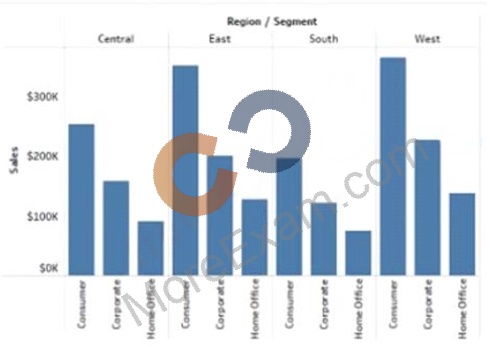
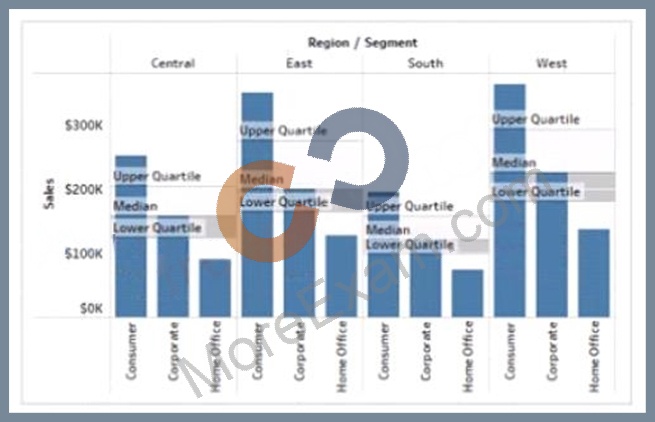
Question5: You have the following bar chart.You want the chart to appear as shown in the Mowing exhibit.What should you add?
Question6: Open the link to Book1 found on the desktop. Open the sales dashboard.Add the Sales by State sheet in a Show/Hide button to the right side of the dashboard.
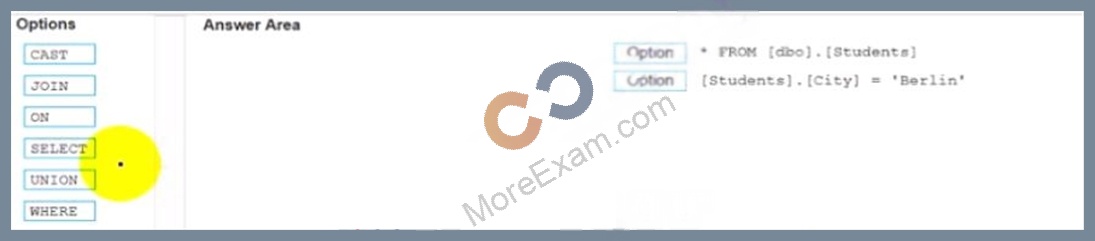
Question7: You conned to a Microsoft SQL Server databaseYou need to create a custom SQL query that retrieves rows from a table named Students Only students m the city of Berlin must be returned How should you complete the query? (Drag the appropriate Options to the Answer Area and drop into the correct locations.)
Question8: You have a dashboard that contains confidential information about patients health. The data needs to always be up to date tor a team of healthcare workers How should you share me dashboard with the healthcare workers?
Question9: You want to connect a Tableau workbook to a dataset in a Microsoft Excel spreadsheet.What should you do from Tableau Desktop?
Question10: You have the following data source in tableau Server.You need to ensure that the data is updated every hour.What should you select?
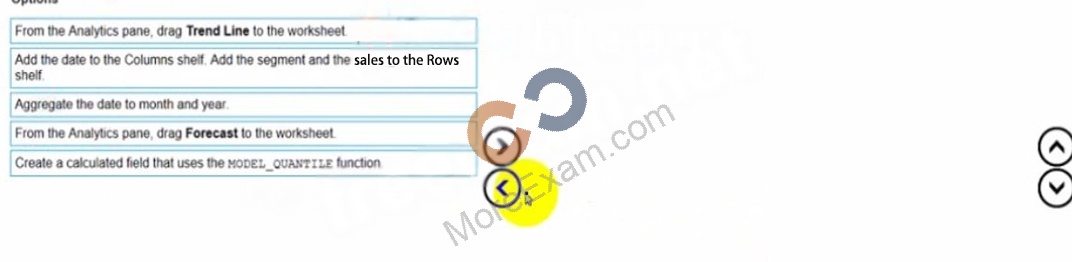
Question11: You have a dataset that contains daily sales by business segment from 2017 to the present You want to use monthly historical trends to predict sales by segment in the future Which three actions should you perform m order?(Place the three correct options in order Use the arrows to move Options lo Answer Area I In Answer Area arrows to re order the options.)
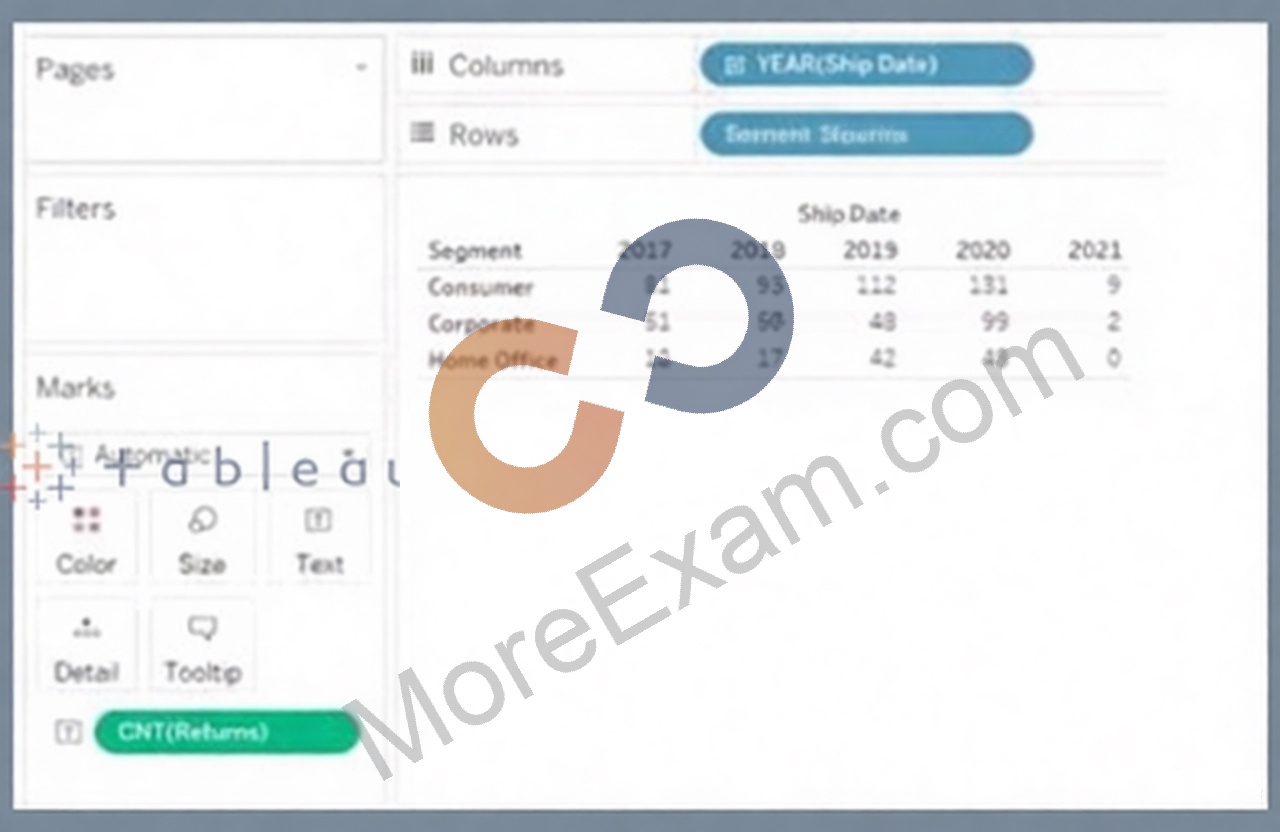
Question12: You have the following visualization.
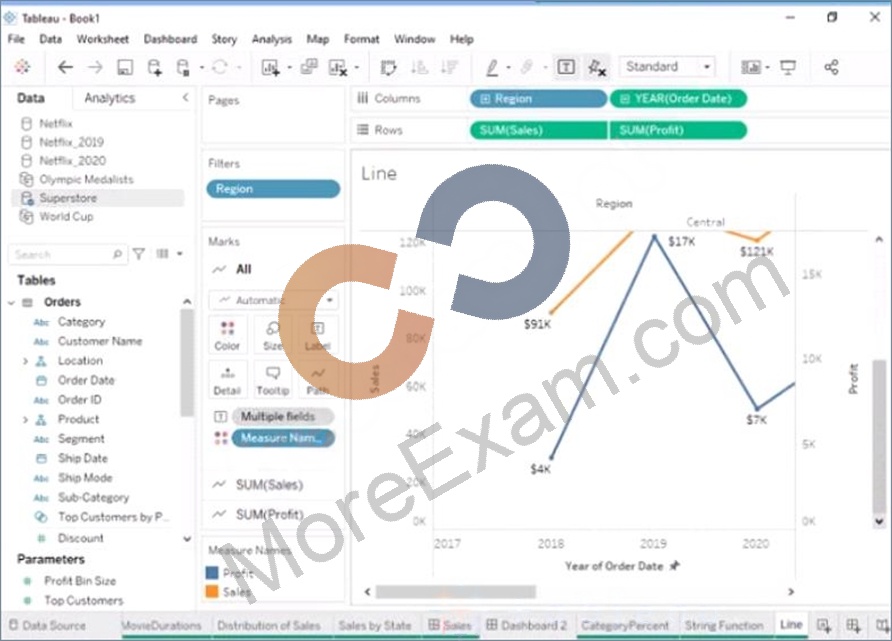
Question13: Open the link to Book1 found on the desktop. Open the Line worksheet.Modify the chart to show only main and max values of both measures in each region.
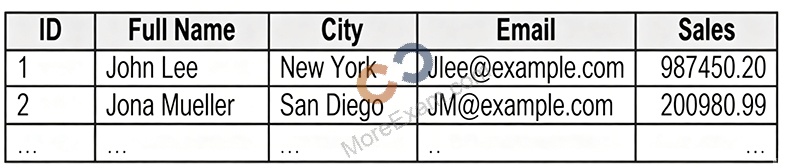
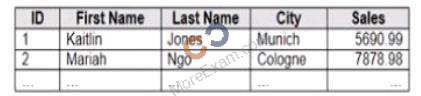
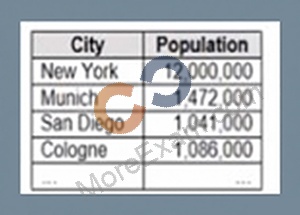
Question14: You company has two divisions located in the United States and Germany Bach division has a separate database. The following is a sample of the sales data for the division in the United States.The following is a sample of the sales data for me division in Germany.You have population data in a file named Populatio.csv. the following is a sample of the data.You plan to create a visualization that ml show tie sales per capita for each salesperson Each salesperson must be identified by identified by their full name.You need to prepare the data to support the planned visualization. The data source must support being published .Which four actions should you perform in order?(Place the four correct options n order Use the arrows to move Options to Answer Area arrows to re-order the options.Use Answer Area arrows to re-order the options)
Question15: You have the following dashboard.Currently the map is used as a filter that affects the data on the otter sheets of the dashboard You need to configure the dashboard to ensure that selecting a data point on the map only tillers the Detail table What should you do?
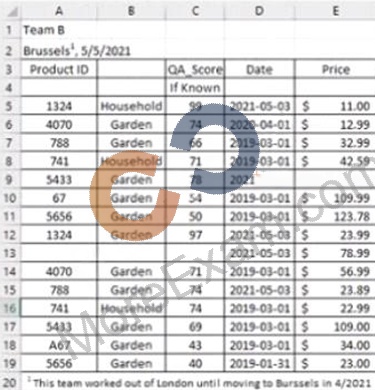
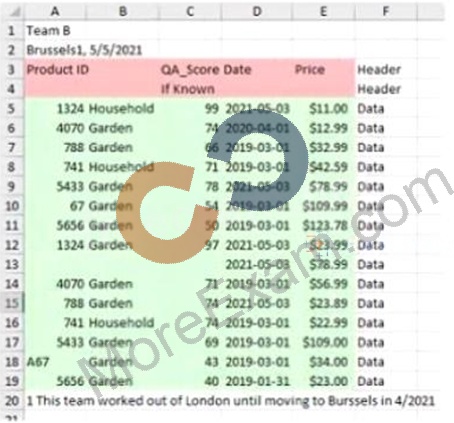
Question16: You have the following dataset in Microsoft Excel.You are using interpreter to cleans the dataset. Data interpreter provides the following results.How many rows of data will be ingested into Tableau as values?
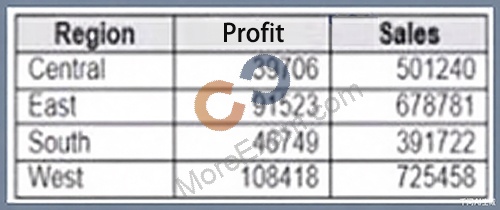
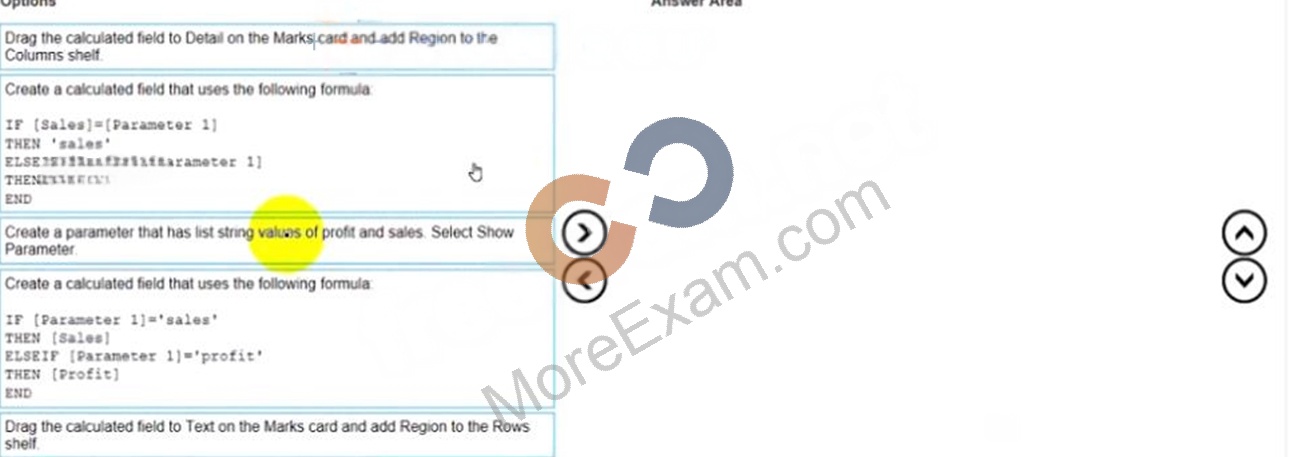
Question17: You have the following dataset.You need to create the following worksheet.The table must show either profit or sales based on the selection from the Parameter 1 menu.Which three actions should you perform in orders(Place the three correct options in order Use the arrows to move Options lo Answer Area Use Answer Area arrows to reorder the options)
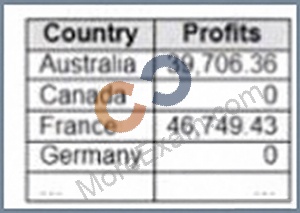
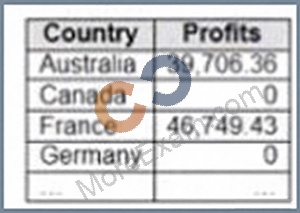
Question18: You have the following dataset that contain null values in the Profits field.You want the data to appear as shown in the following table.Which two formulas achieve the goal? Choose two.
Question19: You publish a dashboard tut uses an attract. The extract refreshes every Monday at 10:00.You need to ensure that the extract also refreshes on the last day of the month at 18:00.What should you do?
Question20: You have a Tableau workbook that contain three worksheets named Sheet1 Sheet2 and Sheet3.You create several filters.From the Data Source page you plan to add data source fillersWhen type of filter will appear in the Edit Data Source Filters dialog box?