EMT Practice Test

1. Question Content...


Question List

Question1: True or False: Tableau can create worksheet-specific filters

Question2: A dual axis chart is useful for comparing two measures that___________.

Question3: You can _______________ your data to combine two or more tables by appending values (rows) from one table to another

Question4: Which of the following are valid ways of Grouping Data?

Question5: Which of the following URL prefixes are permitted when creating a URL Action in Tableau?

Question6: Using the Geo Data Table, create a Map showing Sales made per State. For the State of New York (NY), what was the amount in Sales ($) made for Phone Assortments with White color?

Question7: Which statement accurately describes aliases?

Question8: What are three options to change the scope of a reference line? Choose three.

Question9: Which of the following is NOT a new feature introduced in Tableau 2020.1?

Question10: Using the Geo Data table, create a Bar chart showing the In-Stock percentage for each Color. What is the Average In-Stock percentage for the Color Red? Present your answer correctly upto 2 decimal places.

Question11: Which of the following are valid ways to add Totals to a view?

Question12: When exporting a worksheet as an image in Tableau, which of the following file formats are available?

Question13: How can you change the Default Aggregation for a measure in Tableau?

Question14: What should you use to create headers in a visualization?

Question15: The default path for all supporting files, data sources, icons, logs etc is in ______________________

Question16: Using the Time-series table, create a cross tab showing the Sales for each Item Number-ID, broken down by Assortments, then add Grand totals to the view. Which Item Number ID made the maximum sales across all assortments?

Question17: When field names in the Union do not match, then:

Question18: Which of the following are true about dimensions?

Question19: Which of the following lets you group related dashboard items together so you can quickly position them?

Question20: A Tableau Data Source File (.tds) contains which of the following?

Question21: Which of the following are FALSE about Joins?

Question22: True or False: When relating tables, the fields that define the relationships must have the same data type.

Question23: How do you identify a continuous field in Tableau?

Question24: What is the one critical difference between normal calculated fields, and the calculated fields created after Data blending?

Question25: _________________ are a local copy of a subset or entire data set that you can use to share data with others, when you need to work offline, and improve performance.

Question26: Using the dataset, create a bar chart showing the average Quantity broken down by Region, and filtered by Country to only show Japan. What was the average Quantity in the State of Tokyo?

Question27: Which of the following points are True about Viz Animations?

Question28: What are two use cases for creating hierarchies from the Data pane? Choose two.

Question29: ________________ is hosted by Tableau to share our visualisations publically with the world.

Question30: Tableau auto-generates ____________ dimension(s) and _____________ measure(s) for us

Question31: You can create _______________ for members in a dimension so that their labels appear differently in the view.

Question32: Which of the following are True for Measure Names?

Question33: True or False: All rows from both tables are returned in an INNER JOIN

Question34: Which Sub-Category had the least Profit in the Office Supplies category?

Question35: Is it possible to deploy a URL action on a dashboard object to open a Web Page within a dashboard rather than opening the system's web browser?

Question36: Given a map, which of the following fields can be placed on Size,Shape,Detail,Color

Question37: Using the CoffeeChain table, create a Dual Axis chart showing the Sales (Bar chart) and Profit (Line Chart) for each Product type. What was the Profit for the Herbal Tea product type in 2013?

Question38: Dates in Tableau are typically treated as ______________

Question39: Suppose you have a bar chart. When we group by labels in a view, which of the following happens?

Question40: Using the CoffeeChain table, create a chart to see the monthly Percent difference change in Profit, from the beginning of 2012 to the end of 2013. How many months saw a Negative percent difference in Profit?

Question41: When you want to first apply a filter and THEN show the Top N or Bottom N elements, which of the following filters would you use?

Question42: Which of the following options best describe measures?

Question43: Using the CoffeeChain table, create a crosstab showing the Total Expenses per State and add Column Grand Totals to the view. Now group the states of New York, California and Washington. What percent of the total sales does this group contribute?

Question44: True or False: Physical tables remain distinct (normalized), not merged in the data source whereas logical tables are merged into a single, flat table.

Question45: You just added this field to the Columns shelf.

What will this create?

Question46: Is SUM a table calculation?

Question47: Download the Dataset from: https://drive.google.com/file/d/12AYHfiPWkwBmvH0zbumOURgUX6Az00Rw/view?usp=sharing Using the Time Series Table, create a line chart to show Sales over time. Which Month and Year witnessed the lowest Sales?

Question48: You need to uniformly change the size for all marks in a view.
What should you do?

Question49: By definition, Tableau displays measures over time as a ____________

Question50: When you drop a continuous field on Color, Tableau displays a quantitative legend with a ___________ range of colors.

Question51: If you see a Blue field, generally it will add _____________ to the view

Question52: _____________ charts are typically used to represent accumulated totals over time and are the conventional way to display stacked lines.

Question53: _____________ contains the visualisations, info needed to build the visualisations, and a copy of the data source.

Question54: True or False: It is possible to add a field to more than one hierarchy

Question55: Which of the following fields would be best used as Dimensions?

Question56: _______________ enables us to create workbooks and views, dashboards, and data sources in Tableau Desktop, and then publish this content to our own server.

Question57: True or False: Enabling any other type of sort (Field, alphabetic, or Nested) clears the manual sort we create.

Question58: When working with Excel, text file data, JSON file, .pdf file data, you can use _________________ to union files across folders, and worksheets across workbooks. Search is scoped to the selected connection.

Question59: In which situation should you save a workbook as a PDF document?

Question60: A field that shows average home values for the United States in 2016 is most likely :

Question61: For which of the following charts, does the Size option on the Marks card not work?

Question62: Given a map, which of the following fields can be placed in Size,Shape,Detail,Color

Question63: Which of these is NOT a type of Quick Filter available in Tableau?

Question64: Which of the following 2 columns CANNOT be deleted in Tableau?

Question65: What are two correct methods to change the data type of a field? Choose two.

Question66: Which of the following are benefits of combining sheets using dashboards?

Question67: What are two ways to share a dashboard as an image file? Choose two.

Question68: What is a story point in Tableau?

Question69: Suppose you create a bar chart by dragging a dimension to the Column shelf and a measure to the Rows shelf. Which of the following would create a stacked bar chart?

Question70: Which two options can you use to change the device layout of a dashboard? Choose two.

Question71: Most viewers scan content starting at the _____________ of a page.

Question72: To use a quick table calculation, which of the following programming languages do you need to know?

Question73: When creating a dashboard for multiple devices, which of the following Device options are available in the Device Preview section?

Question74: Which of the following shapes does a Heat Map use by default?

Question75: You can use the __________________ in Tableau to clean / organise your data.

Question76: How can you format an axis as Bold in Tableau?

Question77: Which two actions can you perform when you join tables from multiple connections? Choose two.

Question78: Which aggregation is available without requiring a table calculation or calculated field?

Question79: If you decide you want to see all of the marks in the view at the most detailed level of granularity, you can __________________ the view.

Question80: According to Tableau's 'Order of Operations', which of the following filters is applied FIRST?

Question81: What is created by a calculated field that has a formula of SUM(Sales)/SUM(Profit)?

Question82: Using the Time Series Table, create a Line chart showing the Monthly Year over Year Growth for the Sales, broken down by Assortment. For the Electronics assortment, which Month had the most NEGATIVE value of Year over Year Growth?

Question83: Create a Set containing Customer Names whose Sales are GREATER than 30,000. Which customer had the LEAST sales in this set?

Question84: True or False: We can disaggregate the data, to see all of the marks in the view at the most detailed level of granularity

Question85: Which of the following are required to create a trend line?

Question86: You need to create a calculation that returns a customer name followed by a comma, a space, and then the customer's age (for example: John Doe, 32).
What should you include in the calculation?

Question87: True or False: It is not possible to blend axes for multiple measures into a single axis

Question88: Which of the following are valid ways to italicize Tooltip content in Tableau?

Question89: Which of the following are valid Layout Container types when using Dashboards in Tableau?

Question90: Which of the following represent a valid method to create a Bullet Graph with the LEAST number of fields possible?

Question91: How can you add color to marks in the view in Tableau?

Question92: Which mark type is used in a highlight table?

Question93: When using a data source that has relationships, how can you add a join between two or more tables?

Question94: Which of the following are valid Dashboard size options?

Question95: For a relative date filter, the default anchor is _________________

Question96: We can join a maximum of ______ tables in Tableau

Question97: Our use case states that we need to create a set showing the Bottom 10 products by Profit in each Region. Which of the following filter types should you apply on Region?

Question98: You have the following legend.

What occurs when you click the icon to the right of Air Ticketing Cabin Type Name?

Question99: How would you calculate GDP per capita in Tableau?

Question100: Broadly speaking, when users connect to Tableau, the data fields in their data set are automatically assigned a ____________ and a ____________.

Question101: Which of the following is a good reason for using a bullet graph?

Question102: Which of the following are valid ways to export a dashboard with multiple visualisations as an image?

Question103: Which of the following 2 fields CANNOT be deleted in Tableau?

Question104: The row and column shelves contain ___________________

Question105: What are three geographic roles that you can assign to a field? Choose three.

Question106: As a general best practice, how many categories can a pie chart display effectively?

Question107: True or False: Sets can be created on Measures

Question108: When there are both negative and positive values for a field, the default range of values will use two color ranges. This is known as a ______________ palette.

Question109: DOWNLOAD THE DATASET FROM: https://drive.google.com/drive/folders/1WXzqsrNmXVdmQ-574wld4InEplyKT8RP?usp=sharing (if you haven't already) Using the cwurData table, plot a Map to see which country had the Second highest number of patents in the Year 2013?

Question110: When creating a histogram in Tableau, to what does bin size refer?

Question111: What term is used to describe the following picture?
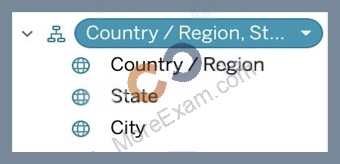
Question112: You have a bar chart that has a dimension on the Columns shelf and a measure on the Rows shelf.
How can you make a stacked bar chart?

Question113: When should you use a relationship instead of a join for two data sets?

Question114: True or False : Bins can be created on dimensions

Question115: Which statement accurately describes a join?

Question116:

Question117: Which of the following sets would you use to compare the members?

Question118: Which of the following can help us focus on specific data without removing data in the visualization?

Question119: You have cleaned a data source properly, created some calculated fields and renamed some columns. You want to save these changes for future use cases. Which of the following would BEST satisfy this requirement?

Question120: Using the Time Series Table, create a Line chart showing the Monthly Year over Year Growth for the Sales, broken down by Assortment. For the Electronics assortment, which Month had the most NEGATIVE value of Year over Year Growth?
Using the Time Series Table, create a Line chart showing the Monthly Year over Year Growth for the Sales, broken down by Assortment. For the Electronics assortment, which Month had the most NEGATIVE value of Year over Year Growth?

Question121: Is it possible to use measures in the same view multiple times (e.g. SUM of the measure and AVG of the measure)?

Question122: Dimensions containing ____________ and ____________ values cannot be continuous.

Question123: At a minimum, what do you need to create a simple scatter plot?

Question124: Question 45: Skipped
You have just created a histogram and now want to be able to change the size of bins dynamically. Using which of the following will easily satisfy your requirement?

Question125: In which of the following scenarios would having a live connection be more beneficial than using an extract?